
United States Government Financial Statement Review

People often toss around opinions about the U.S. Government's finances with either vague worry or unwavering assurance. The MMT (Modern Monetary Theory) crowd seems to think that you can print money and everything will be fine, but others are not so sure.
We decided to do a deep dive, treating it just like a company's financial review. We dug into the revenue, expenses, net income, assets, and liabilities to get the real scoop. If this were a company, let's just say the fundamentals would have us worried. Remember, we're talking about trillions of dollars here.
US Government Financial Statement Overview
Income Statement Analysis
Revenue−Expenses = Net Income
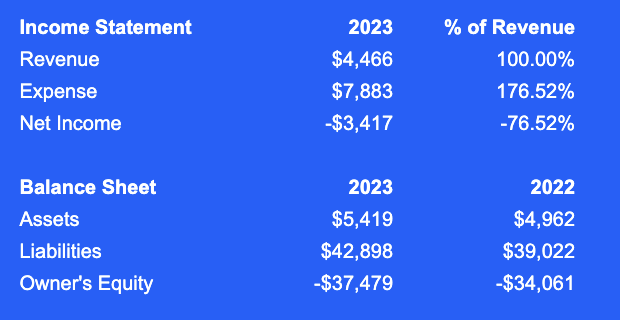
For the fiscal year 2023, the U.S. Government reported a total revenue of $4.5 trillion, marking it as the baseline for financial inflows primarily through various forms of taxes and earnings from investments and government enterprises. Despite this substantial revenue, the expenses for the year significantly exceeded the inflows, totaling $7.9 trillion. This results in expenses being 177% of the revenue, indicating a significant deficit where spending outpaces revenue by a wide margin.
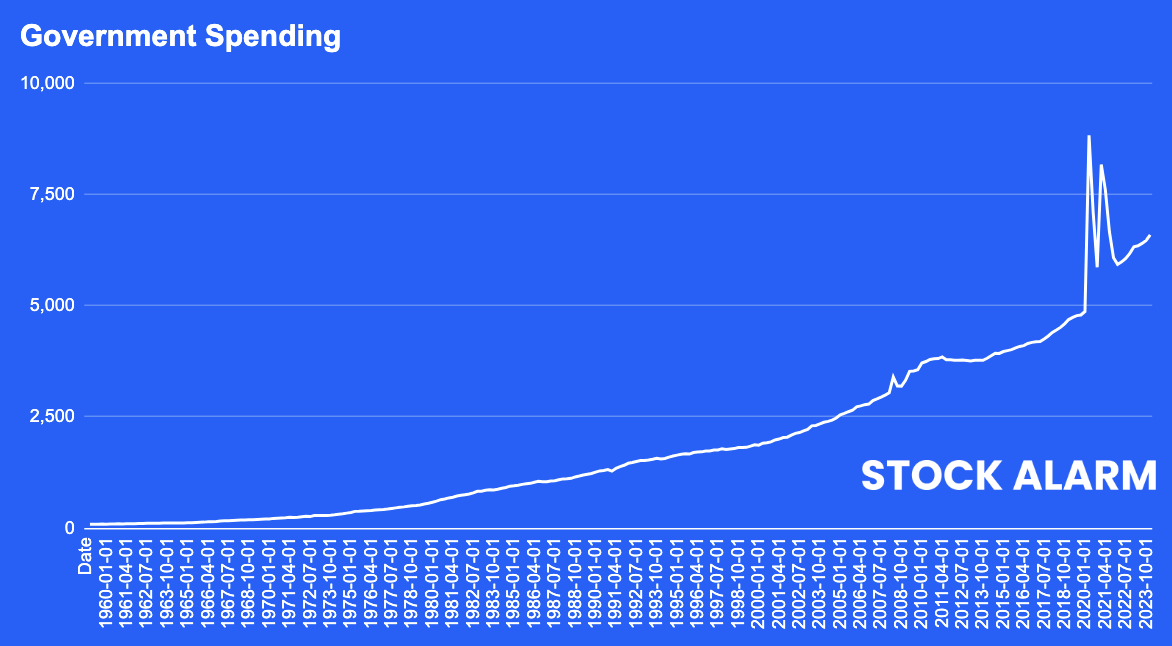
US Government Spending
The net outcome of these figures is a net loss of -$3.4 trillion. This reflects the ongoing fiscal challenge of managing the federal budget where expenditure consistently exceeds revenue, a situation that impacts fiscal policy and long-term economic sustainability.
Milton Friedman said it best:
— Cillian (@CilComLFC) August 16, 2024
“Keep your eye on how much the Government is spending, because that is the true tax.
There is no such thing as an unbalanced budget. You PAY FOR IT either in the form of taxes, or indirectly in the form of inflation or debt.”
Fact check: TRUE ✅ pic.twitter.com/QrFNKazVns
Balance Sheet Overview
The balance sheet provides a snapshot of the government's financial position as of the end of 2023, showing total assets of $5.4 trillion, an increase from $4.96 trillion in 2022. This asset growth reflects modest accumulation in government-held assets, which may include cash, receivables, and significant infrastructure assets.
Conversely, total liabilities stood at a staggering $43 trillion in 2023, up from $39 trillion in the previous year. This liability predominantly consists of federal debt obligations—money borrowed to cover the government deficit—as well as other governmental obligations such as federal employee benefits.
Assets−Liabilities=Equity
The net result is a negative owner's equity, or net position, of -$37 trillion, worsening from -$34 trillion in 2022. This negative equity position highlights the cumulative result of years of budget deficits where total liabilities substantially exceed the government's total assets.
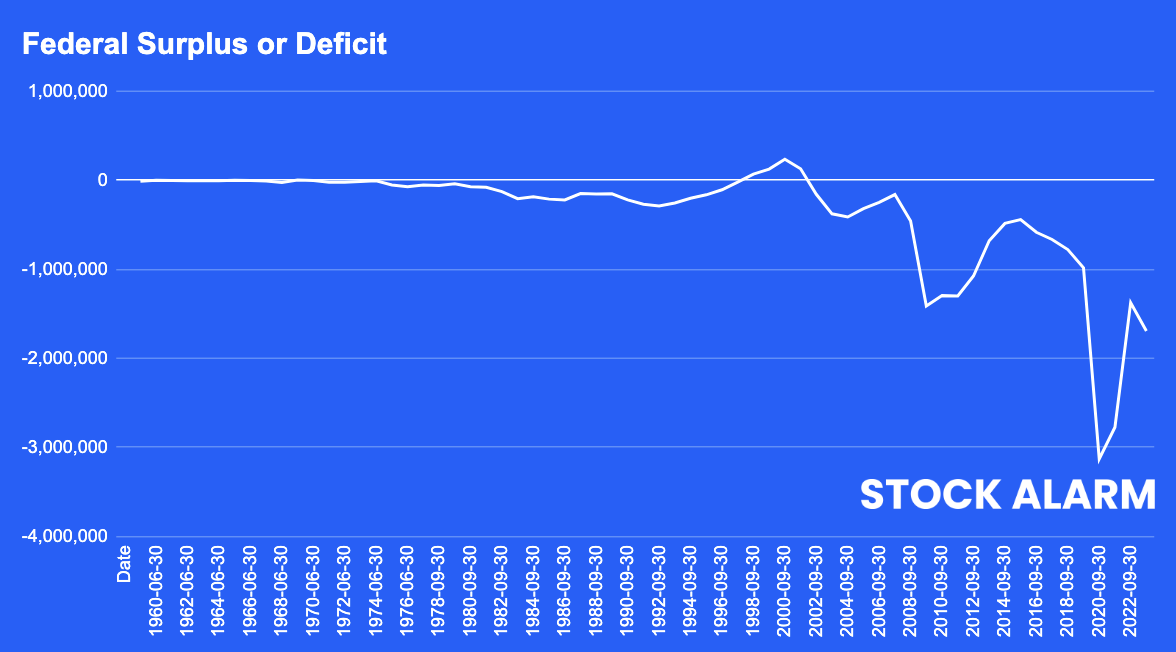
US Government Surplus or Deficit
Implications and Forward Outlook
The figures from the income statement and balance sheet reveal the considerable fiscal pressures on the U.S. economy, driven by persistent deficits and a rising debt burden. The negative net income and further deepening of negative equity underscore the critical need for sustainable fiscal policies. Addressing these challenges requires careful consideration of both revenue enhancements and expenditure reductions.
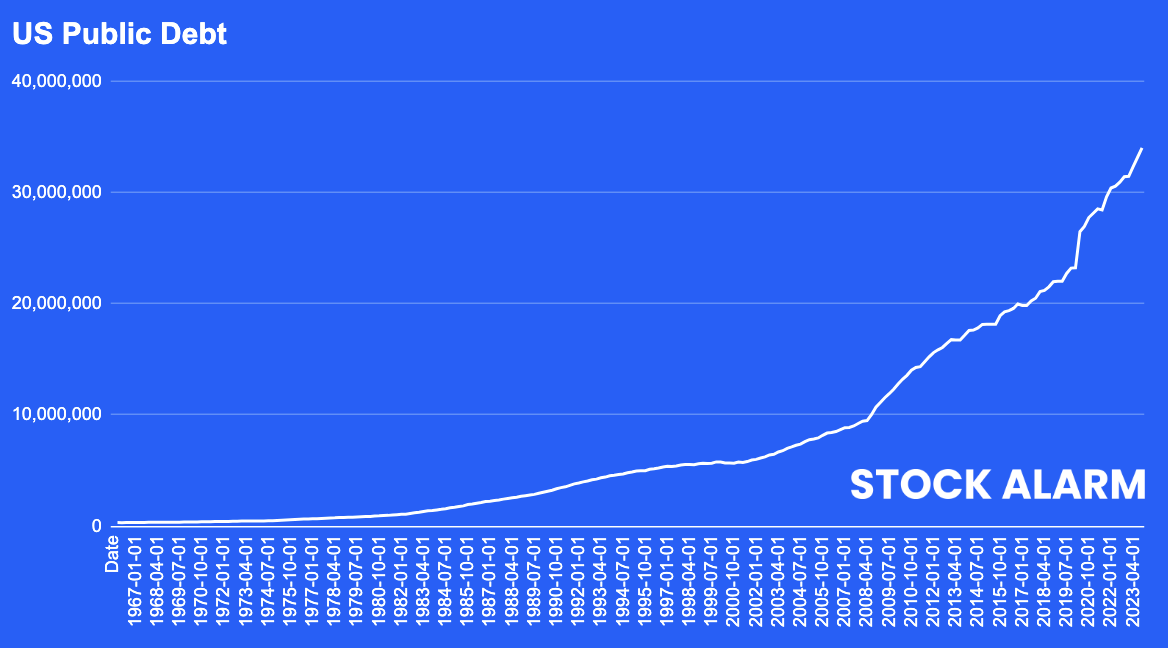
Moreover, the increasing liabilities emphasize the urgency for fiscal reforms aimed at stabilizing and eventually reducing the national debt. Such measures are vital not only for the financial health of the government but also for the broader economic stability of the country, affecting everything from national credit ratings to interest rates and from economic growth prospects to social security.
US Public Debt
Interest on Federal Debt
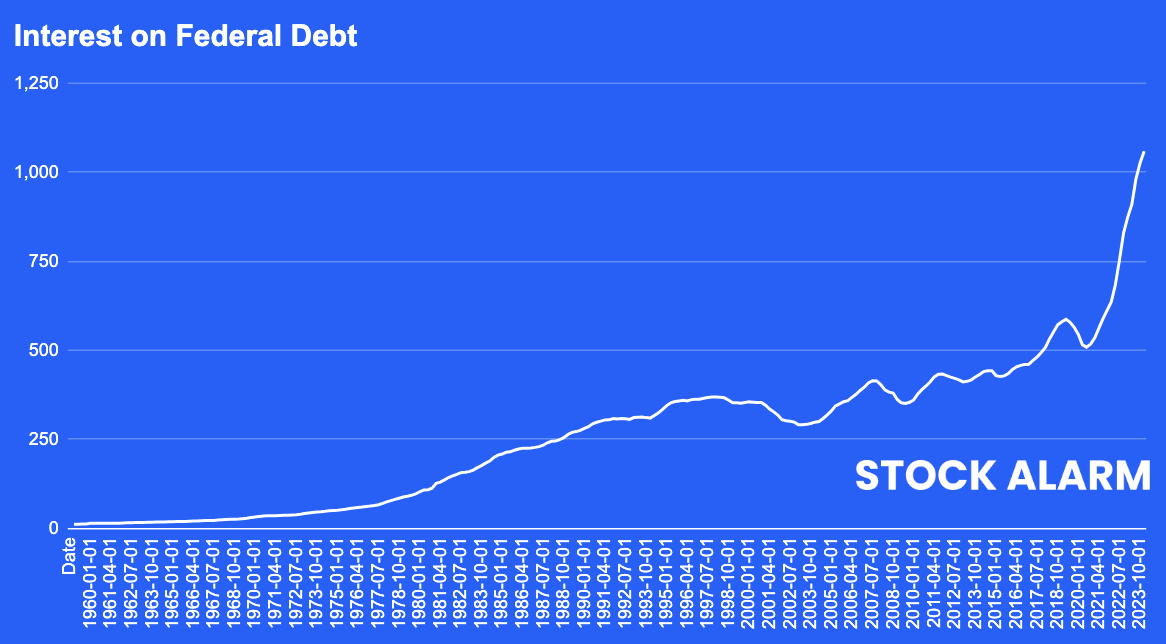
Given the evolving economic conditions and the complexities of global financial interactions, policymakers, stakeholders, and the public must engage in informed dialogue about the paths forward to ensure fiscal responsibility and economic viability. The government's financial health is essential for maintaining confidence in its financial obligations and supporting the nation's economic success.
Government Funding of Fiscal Deficits
The U.S. government's ability to fund its fiscal deficits, as illustrated by the difference between its revenues and expenses, primarily hinges on its capacity to borrow money. This is executed through the issuance of government bonds, notes, and bills, which are purchased by both domestic and international investors, financial institutions, and other governmental entities.
Role of M2 Money Supply
The M2 money supply, which includes all cash, checking deposits, and easily convertible near money, plays a significant role in the economic landscape, affecting liquidity and interest rates. An increase in the M2 money supply can lower interest rates, making borrowing more attractive and cheaper for everyone, including the government.
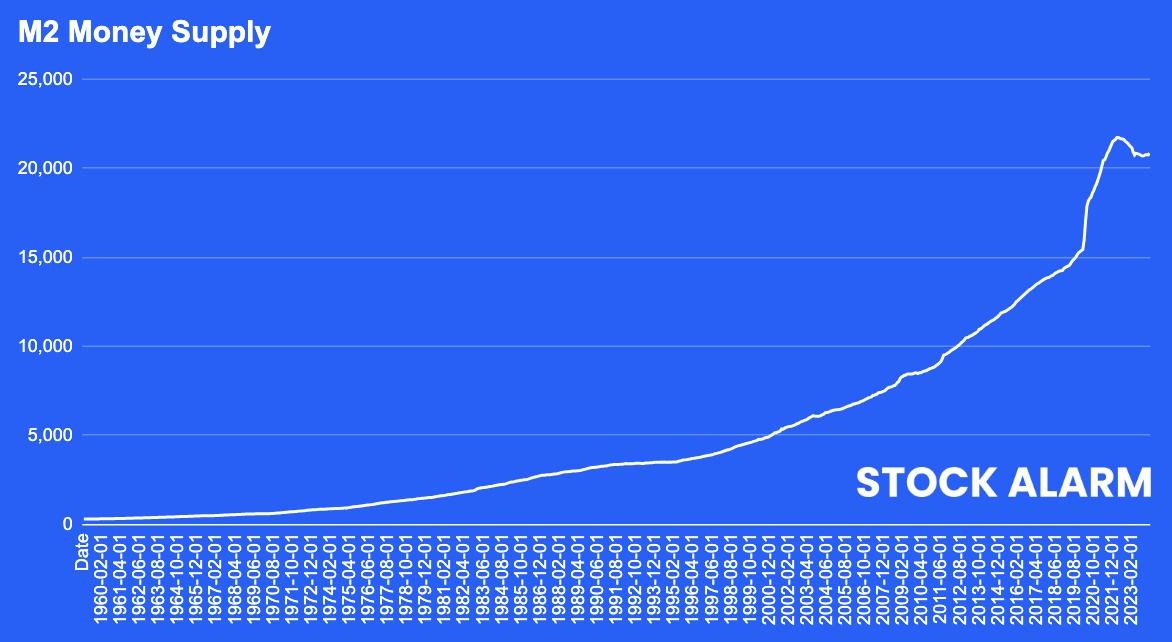
Current Trends in M2 and Fiscal Policy
As seen in the M2 money supply chart, there has been a steep increase in recent years, particularly noticeable around 2020 and beyond. This surge is partly due to governmental and central bank policies aimed at countering the economic impacts of the COVID-19 pandemic, including extensive stimulus measures. These policies have increased liquidity in the economy but also pose risks such as inflation, which we are beginning to see signs of in various economic indicators.
Conclusion:
The U.S. government often manages its fiscal deficits by leveraging the dynamics of the M2 money supply, primarily through printing and borrowing rather than raising taxes—a tempting but risky strategy that can lead to significant economic imbalances. This approach provides essential flexibility in fiscal management but requires careful oversight to avoid triggering unsustainable inflation and interest rate fluctuations, which could detrimentally affect the broader economy. Just look at Japan, where heavy reliance on printing money rather than increasing taxes has led to complex economic challenges, underscoring the need for balance and prudence in such policies.
Notes:
Financial Statements of the United States Government for the Fiscal Years Ended September 30, 2023, and 2022
Charts from stockalarm.io | @stock_alarm